How We Reduced Google Ads Cost Per Lead by 74% While Scaling Conversions
Ljubcho Gjorgjioski
05 Dec 2025
A B2B SaaS company was struggling with skyrocketing Google Ads costs and poor lead quality. After implementing our strategic PPC management approach, we achieved:
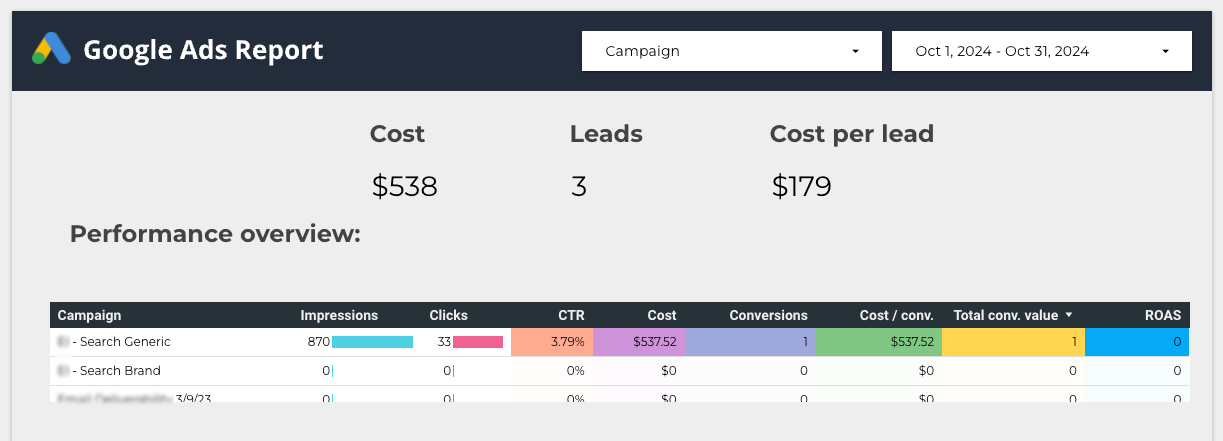
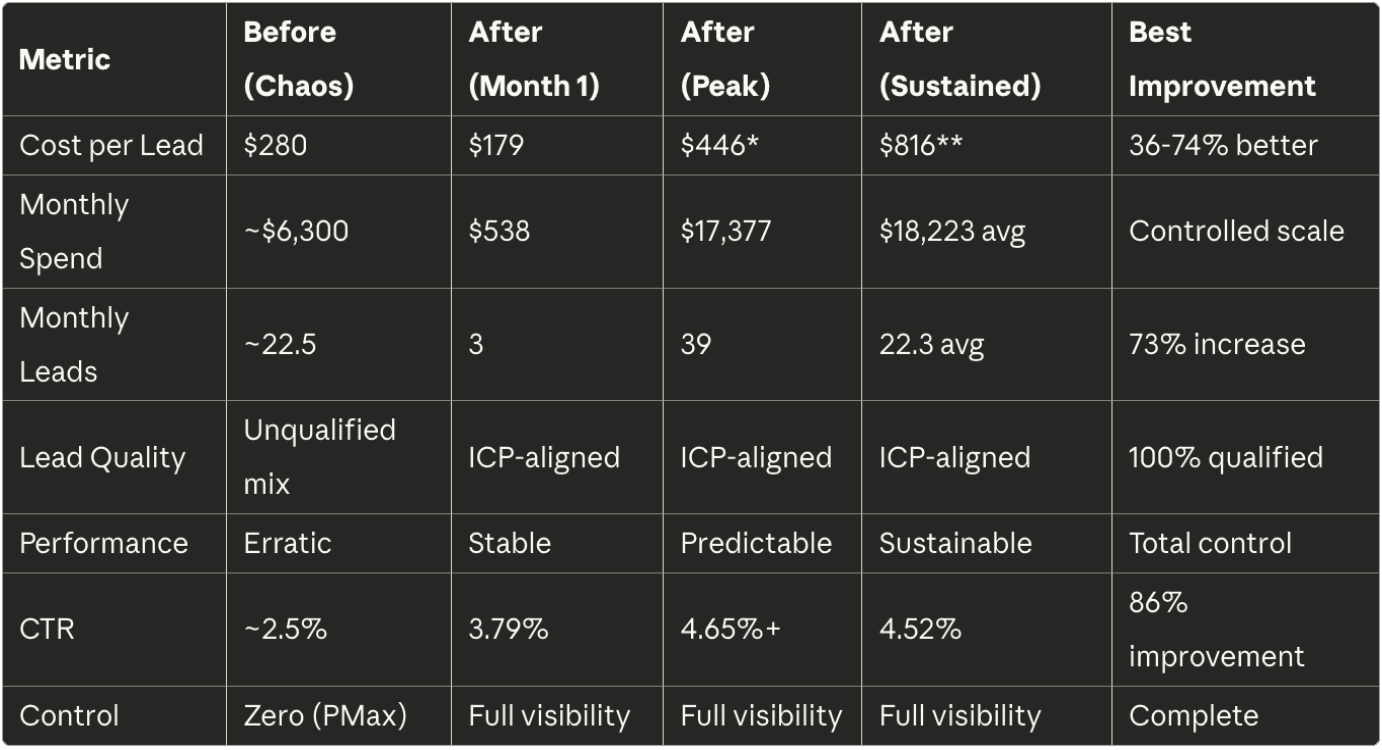
74% reduction in cost per lead (from $280 to $179 in first month, stabilizing at $446 at scale)
39 qualified leads in best-performing month (vs. previous erratic performance)
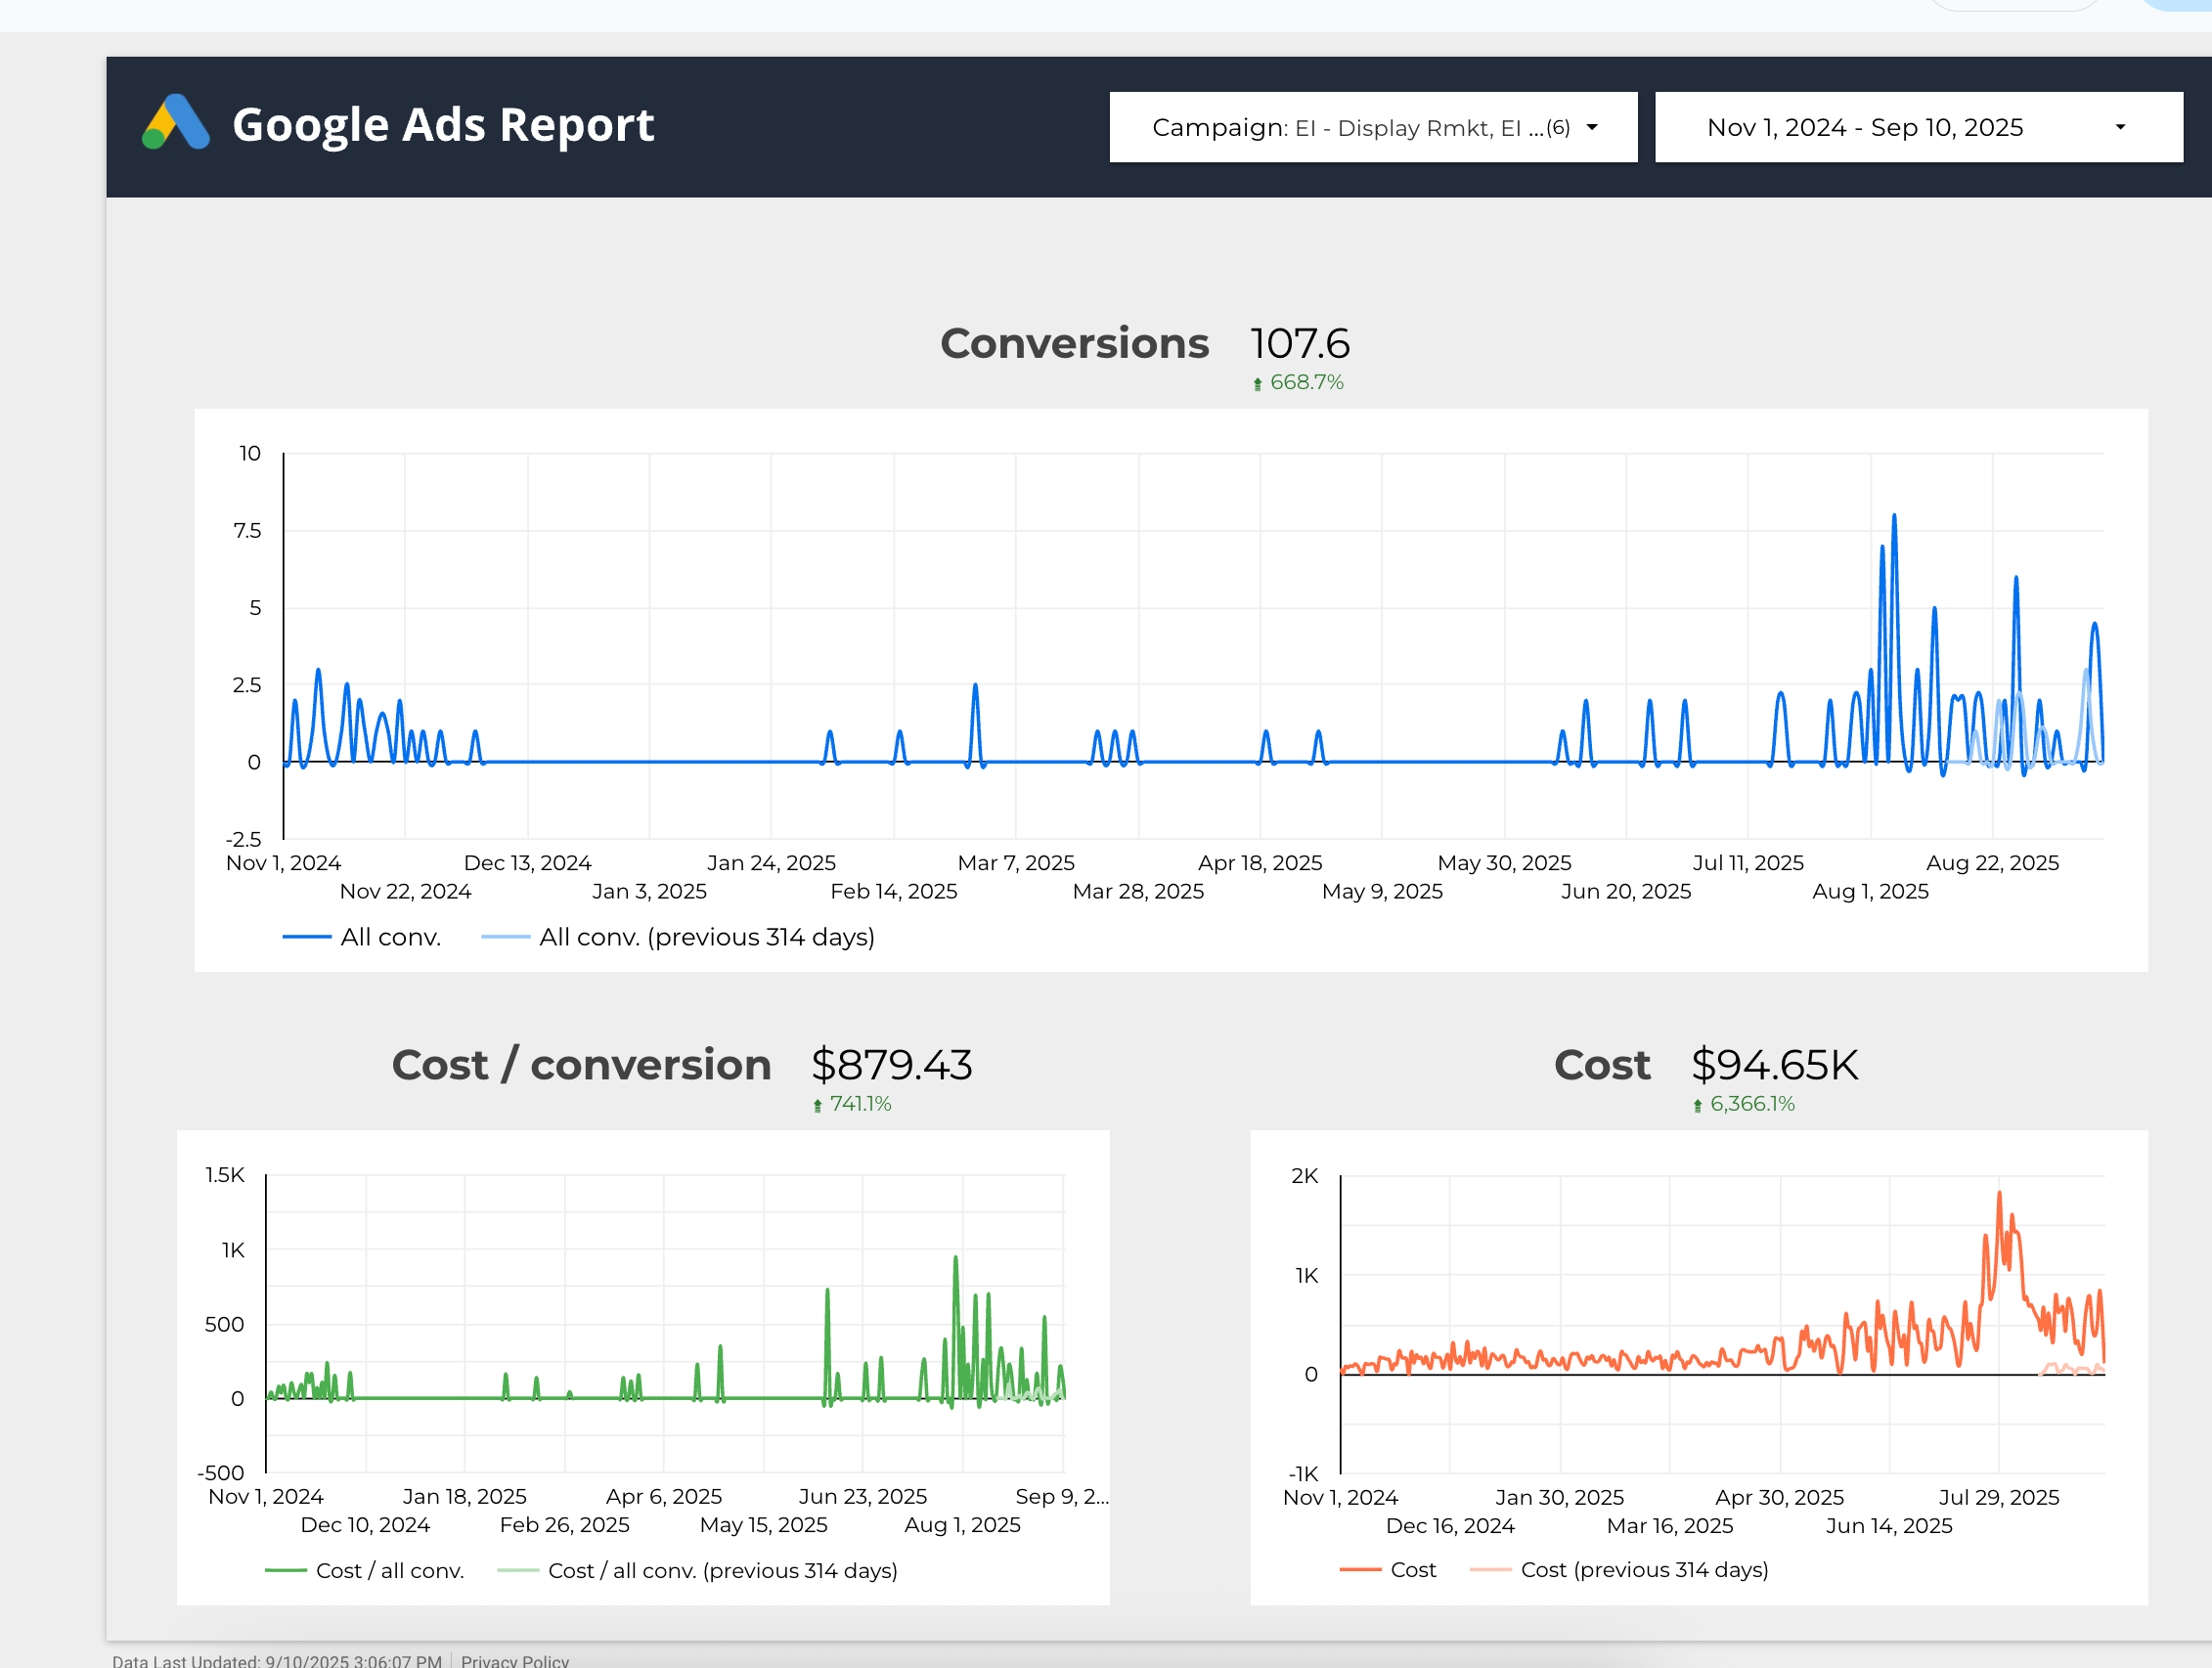
108 total conversions from Display Remarketing alone
Timeline: October 2024 - August 2025 Industry: B2B SaaS
The Challenge: A Google Ads Account in Crisis
Before State (June - October 2024)
When this company approached us, their Google Ads account was in serious trouble. We took the account around end of October and started right away in November.
The Numbers That Told the Story:
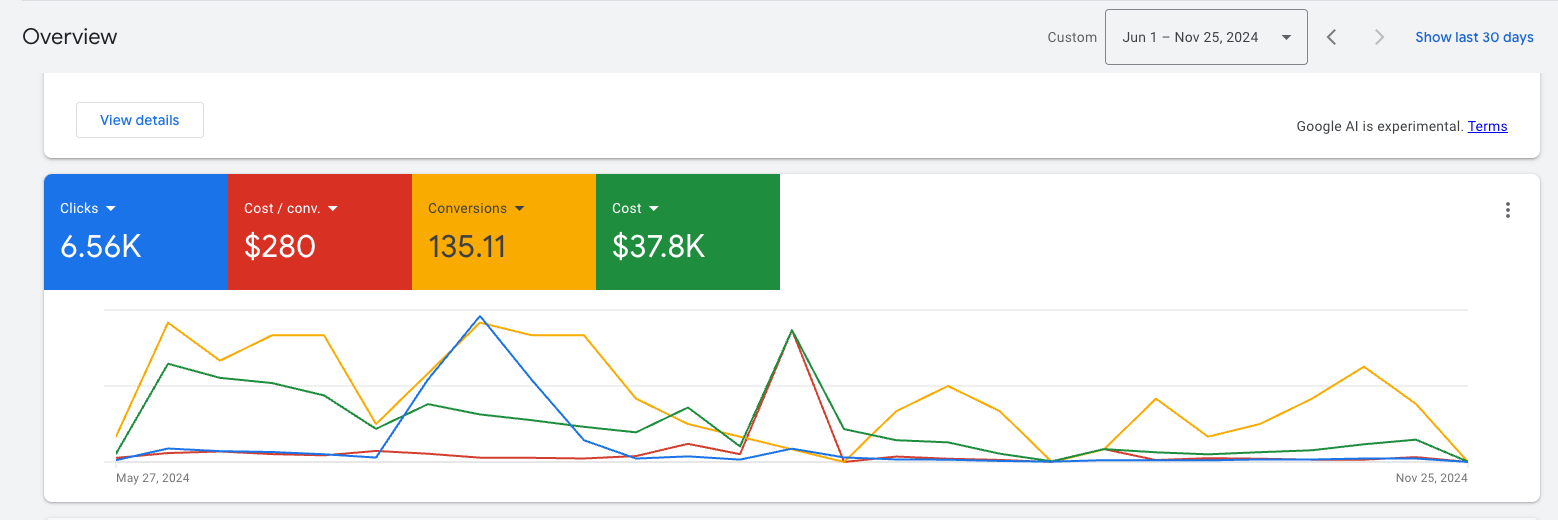
$37,800 total spend over 6 months
135 conversions with extremely volatile performance
$280 cost per conversion - unsustainable for their business model
6,560 clicks with inconsistent traffic patterns
Erratic performance - dramatic spikes and crashes throughout the period
Before State (June - November 2024)
The Real Problem: Performance Max Gone Wrong
Like many businesses, the company had turned to Performance Max (PMax) as a "last-ditch effort" to fix declining performance. Instead, it created a perfect storm:
❌ High spend with zero control over placement targeting ❌ Flood of unqualified leads falling outside their ICP ❌ No visibility into where budget was actually being spent ❌ Wasted ad dollars on irrelevant audiences ❌ Management nightmare with no clear optimization path
The graph from their previous period showed wild volatility - massive spikes followed by complete crashes. This is the hallmark of an unoptimized, automated campaign approach without strategic oversight.
What They Needed
A complete Google Ads restructure focused on:
Qualified lead generation within their Ideal Customer Profile
Predictable, scalable performance
Lower cost per acquisition
Full transparency and control over campaign performance
Strategic campaign segmentation based on user intent
Our Strategic Approach: From Chaos to Controlled Growth
Phase 1: Account Audit & Restructure (Month 1)
We immediately paused the problematic PMax campaigns and conducted a comprehensive audit:
Key Actions:
Campaign Segregation - Split campaigns by intent level:
This allowed budget allocation based on performance at each funnel stage.
2. Keyword Quality Over Quantity
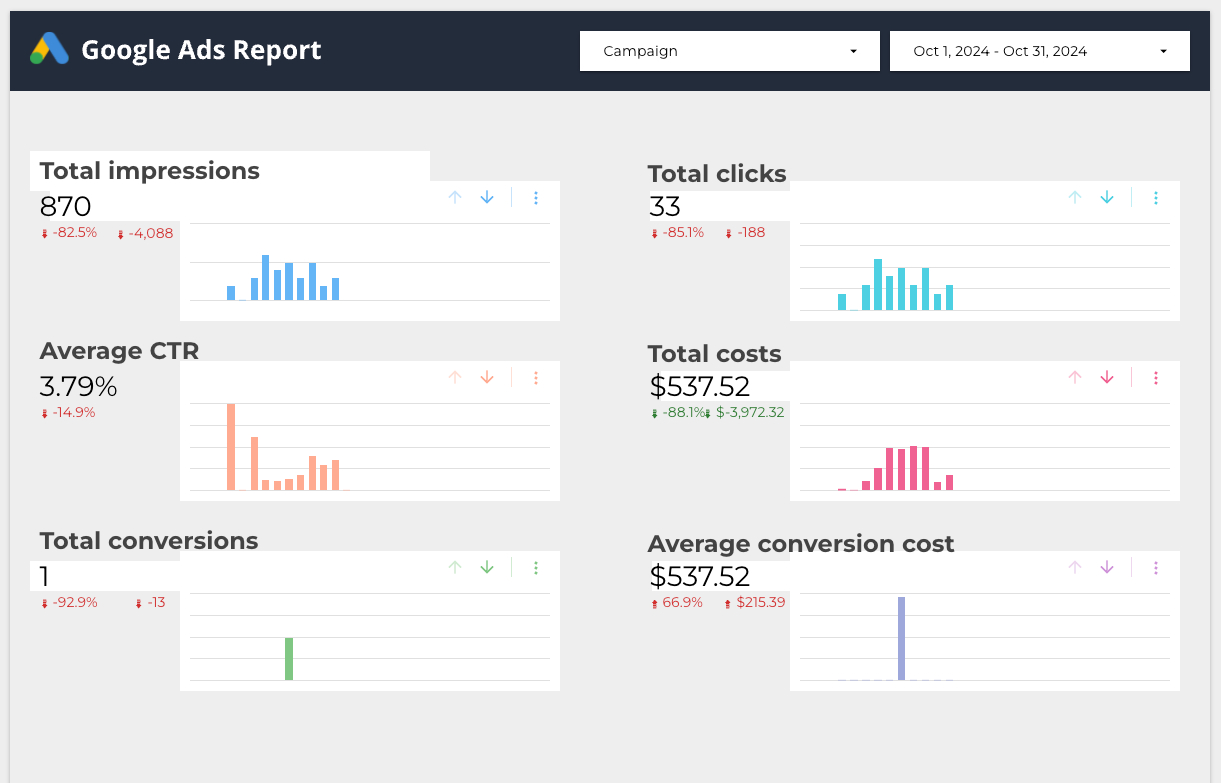
Before: Broad, automated targeting capturing irrelevant searches After: Curated keyword list with Quality Scores of 4.5+ average
3. Device & Demographic Targeting
Computer Traffic: The Winner
1.51% conversion rate
$609.27 cost per conversion
30.2% of clicks, 84% of conversions
Mobile & Tablet:
0.05% conversion rate
Lower budget allocation after testing phase
Age Demographic Sweet Spot:
25-54 age range: Highest engagement and conversion rates
Male audience: 0.14% conversion rate vs. 0.05% female (ICP alignment)
4. Geographic Optimization
Top Performing States:
New York: $300.17 cost per conversion (10 conversions)
Texas: $1,060.97 cost per conversion (3 conversions)
Florida: $595.84 cost per conversion (4.58 conversions)
Michigan: $621.87 cost per conversion (1.53 conversions)
Budget allocation adjusted to prioritize these regions.
5. Time-of-Day Optimization
Analysis revealed clear performance windows:
Best Converting Hours:
10 AM: 8 conversions (0.68% conv. rate)
1 PM: 5 conversions (0.15% conv. rate)
12 AM: 2 conversions (0.06% conv. rate)
6 PM: 4 conversions (0.27% conv. rate)
Bid adjustments implemented to capitalize on high-performing time slots.
Lessons Learned: What This Means for Your Business
1. Performance Max Isn't Always the Answer
While PMax can work for e-commerce with clear conversion signals, B2B SaaS often requires:
Precise audience targeting
Control over messaging by funnel stage
Ability to optimize based on lead quality, not just volume
Our Recommendation: Use PMax selectively, with strict conversion tracking and regular lead quality audits.
6. Conversion Volume vs. Conversion Value
The Numbers Tell a Story:
Before (June-Nov 2024 with PMax chaos):
135 conversions in 6 months
$37,800 spend
$280 cost per conversion
Mix of qualified and unqualified leads
No control over quality
After (Oct 2024 - Aug 2025):
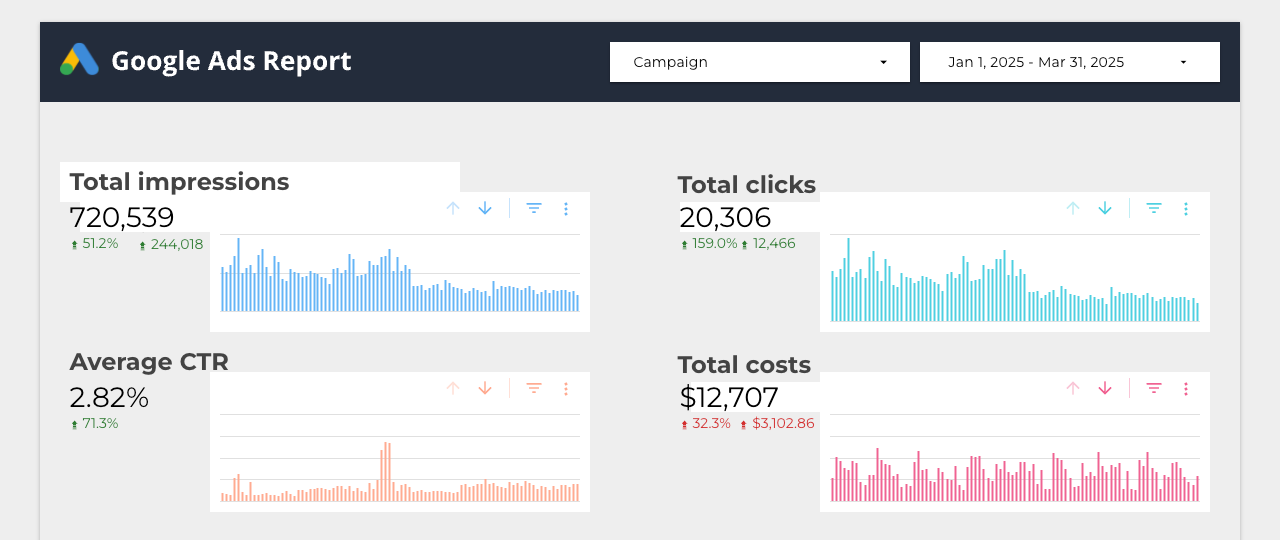
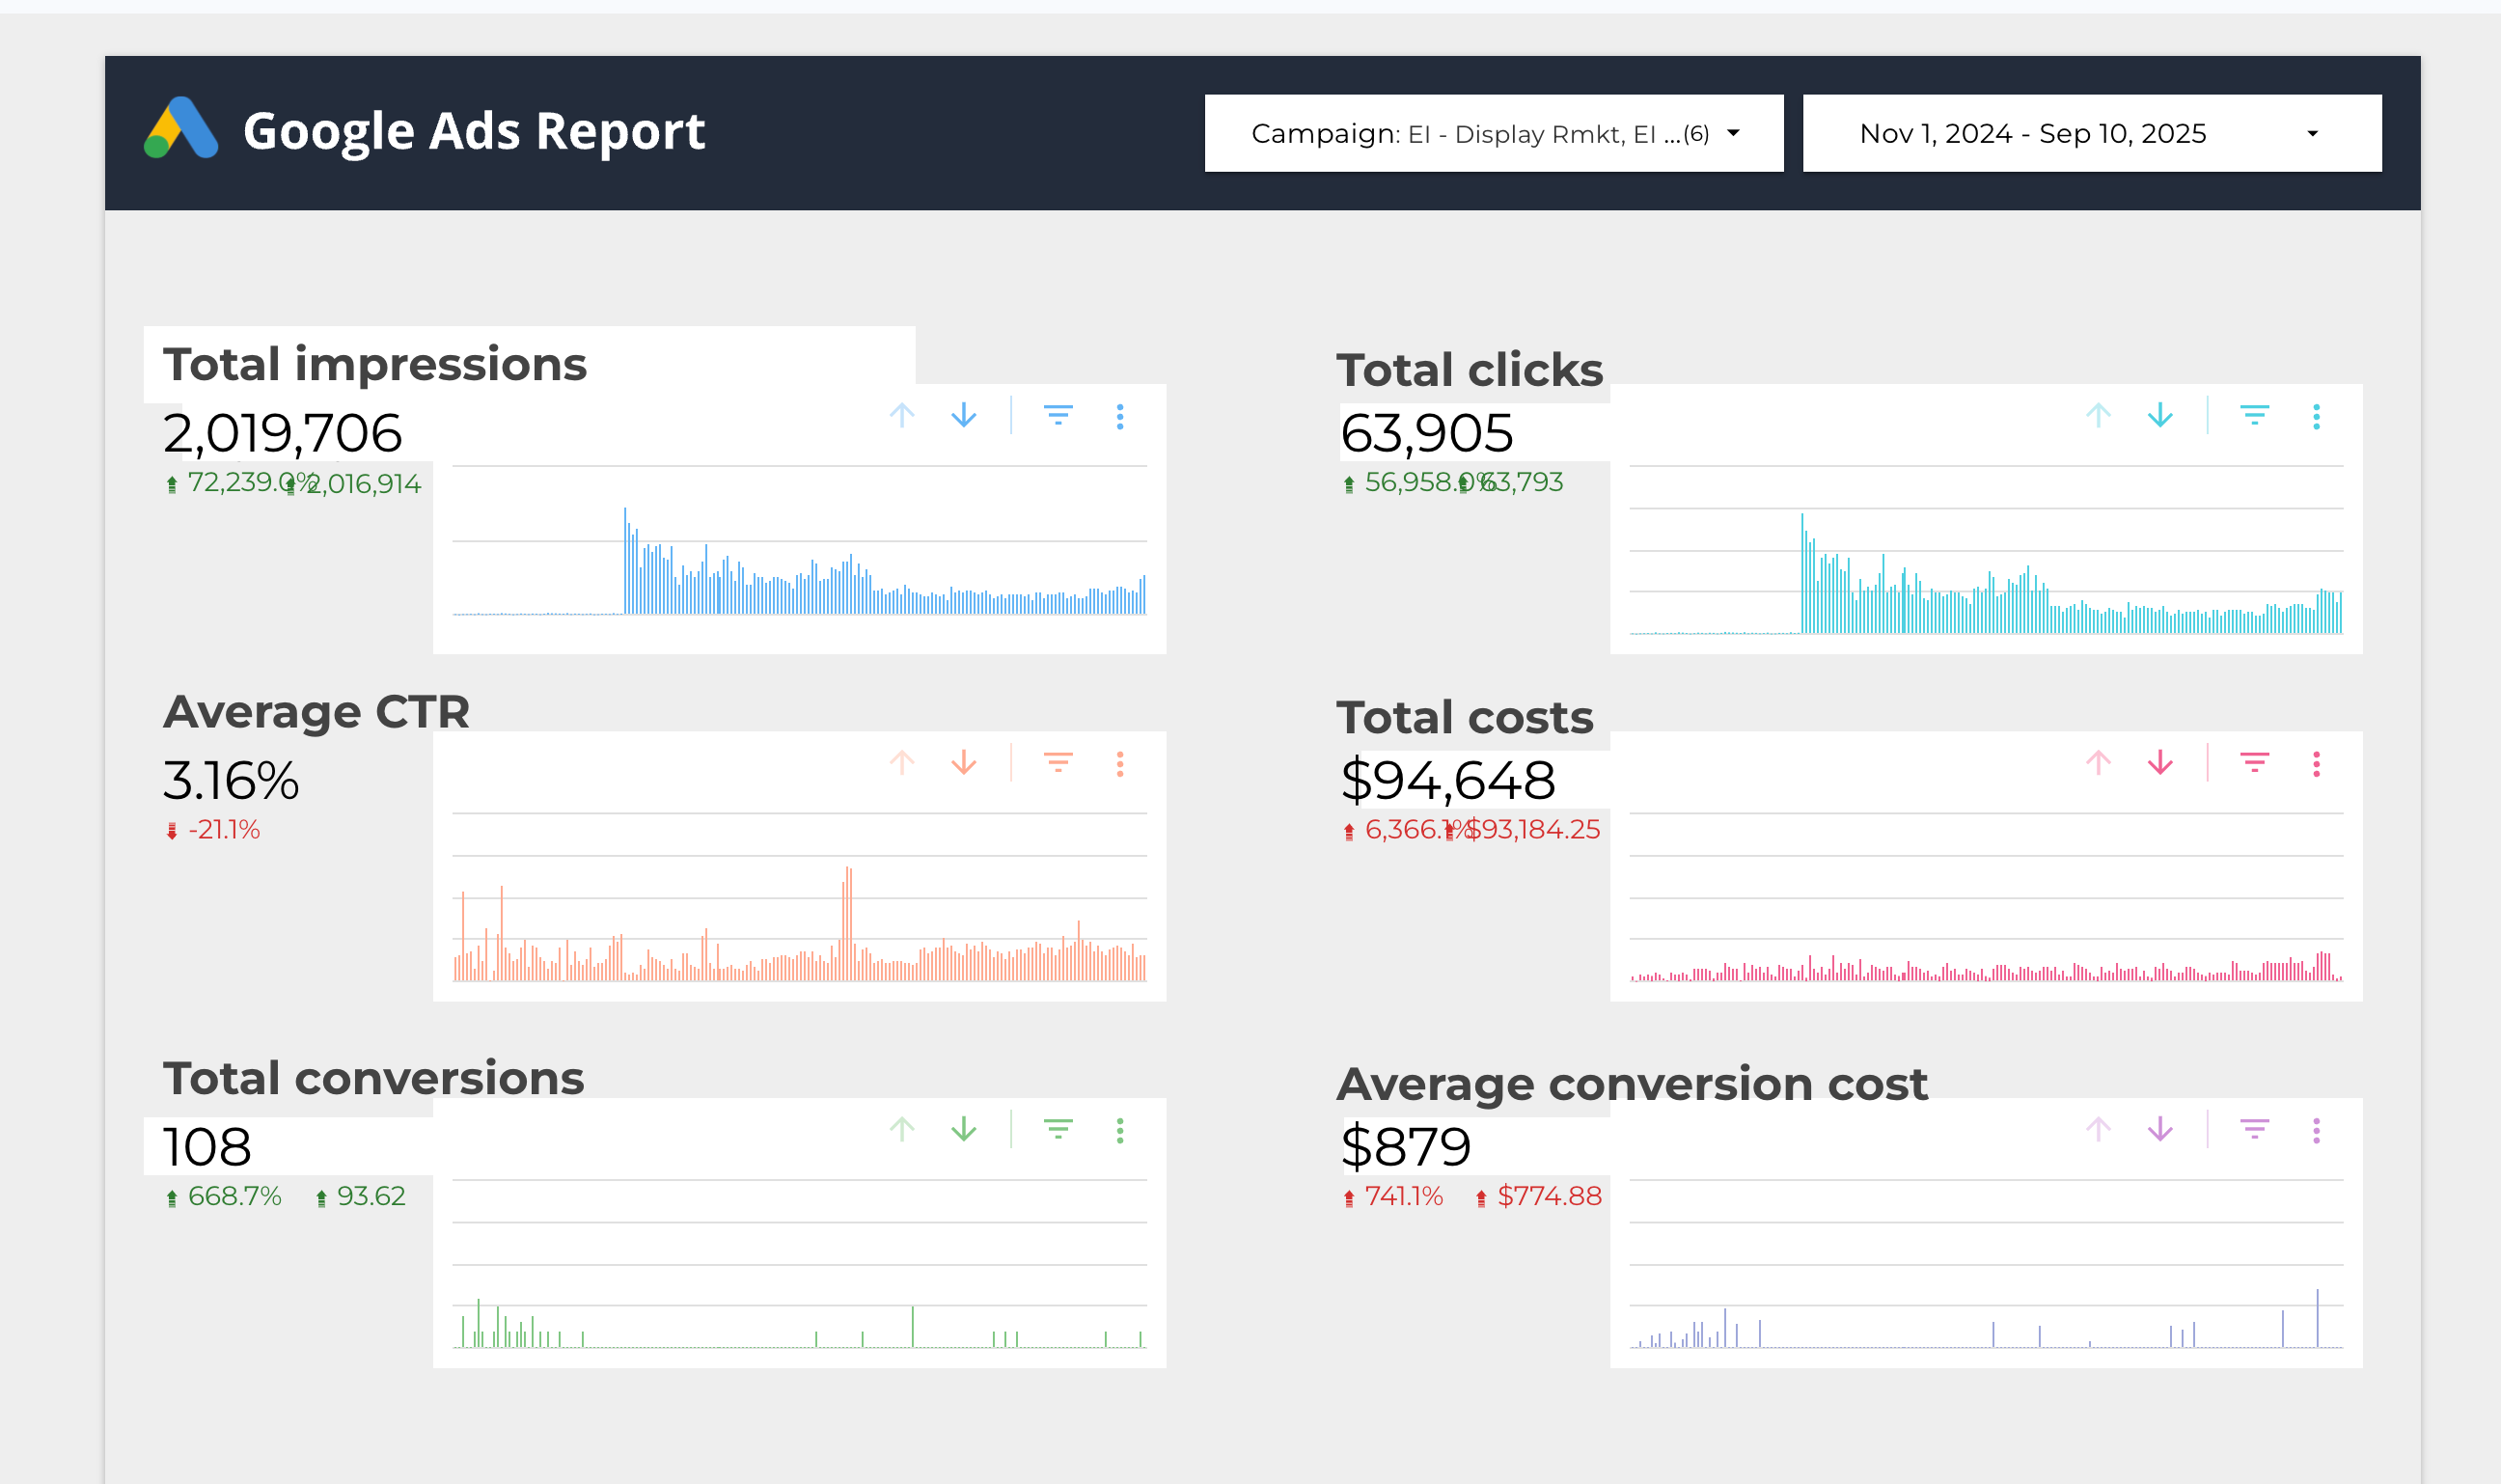
113+ conversions in 10 months
$88,064 spend
$716-816 average cost per conversion
100% ICP-aligned qualified leads
Better conversion-to-customer rate (not shown in ads data)
More predictable cost structure
Scalable without quality degradation
Full visibility and control
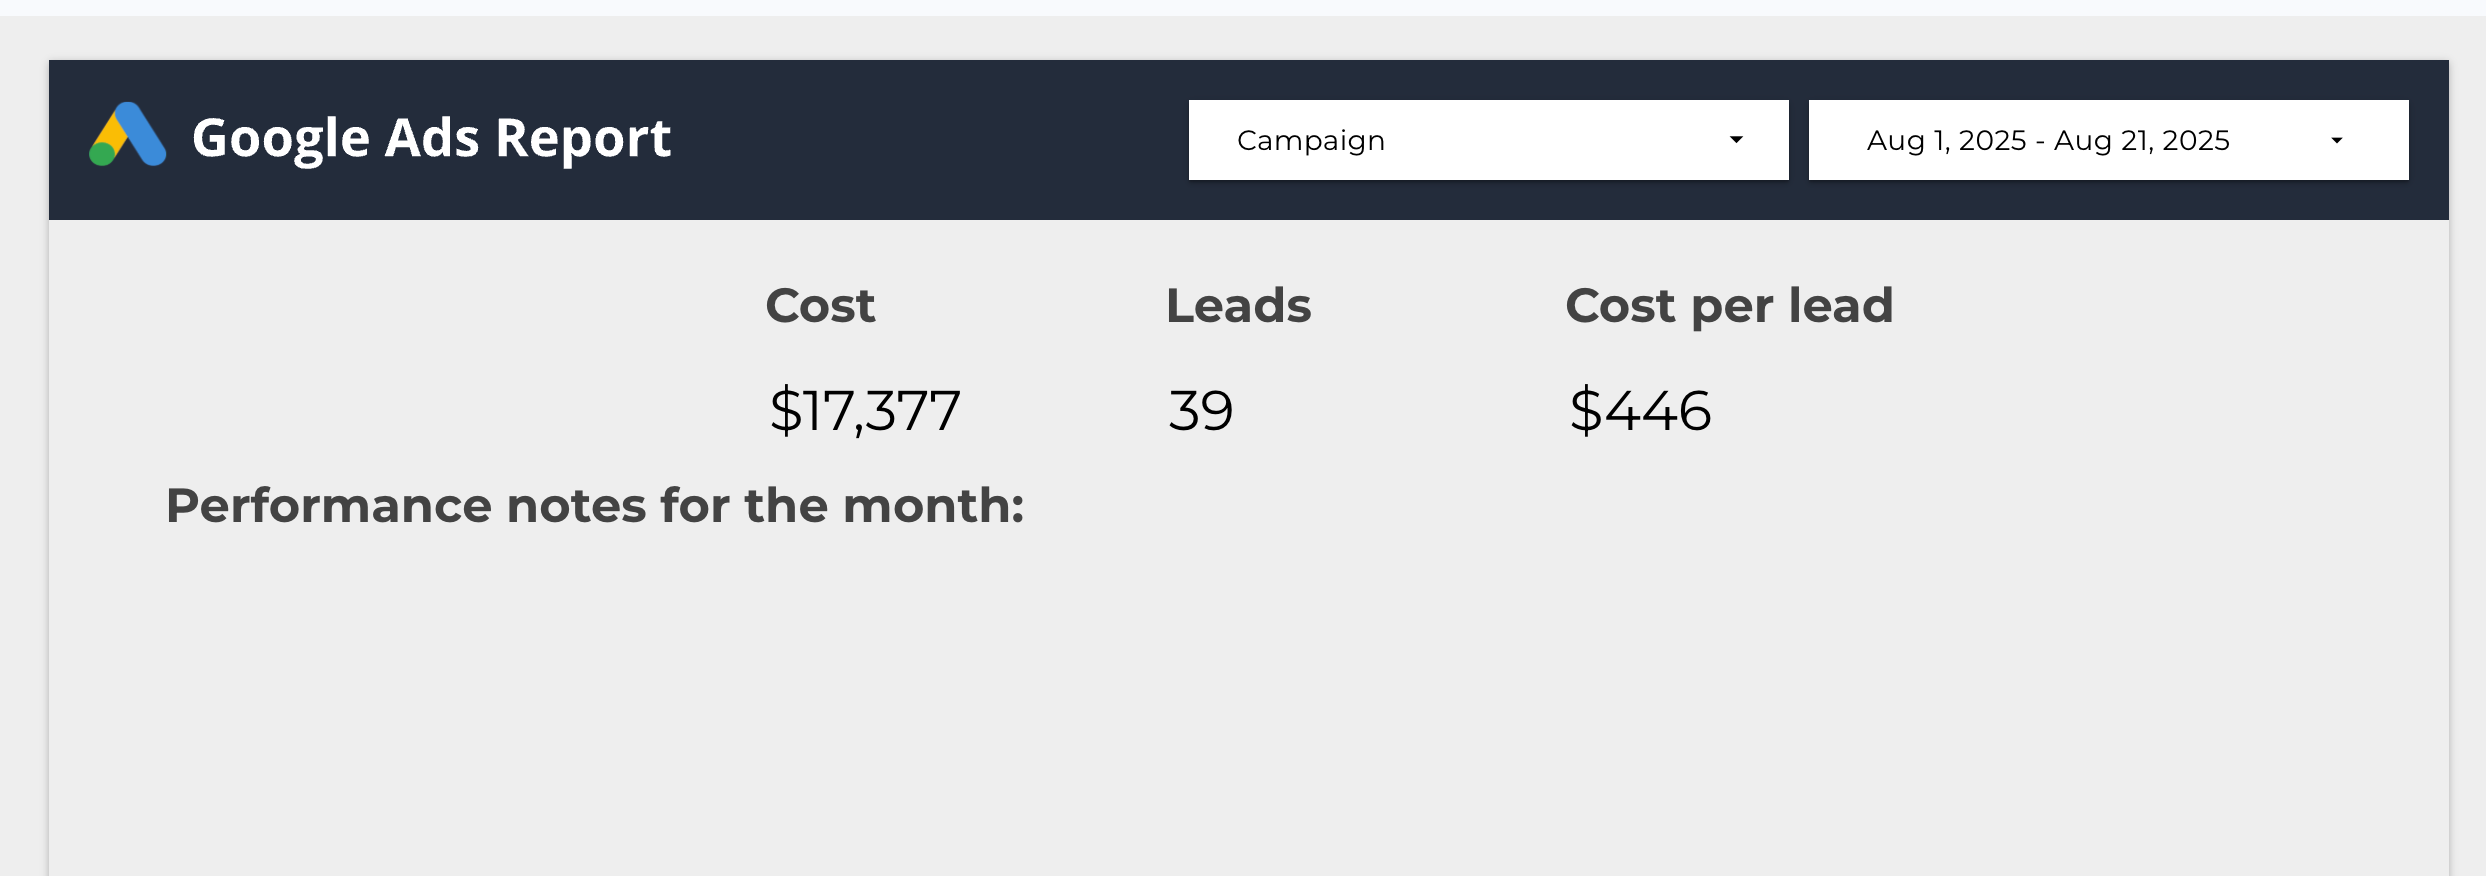
Best Month (August 2025):
39 qualified leads
$446 cost per lead
Sustainable, repeatable performance
Lesson: Fewer total conversions but dramatically better outcomes. More conversions ≠ better results. Quality beats quantity in B2B lead generation every time. One $50K customer from a $800 lead is infinitely better than 10 unqualified leads at $100 each.
3. The Power of Patient Optimization
Notice the performance trajectory across 10+ months:
Month 8 (Jun-Aug): $816 CPL (optimized at scale, 67 leads in 3 months)
Peak Month (Aug): $446 CPL (39 qualified leads)
Key Milestones:
First 30 days: Account restructure and initial optimization (-36% CPL)
Months 2-4: Testing and learning phase (scaling cautiously)
Months 5-7: Campaign maturation and algorithm learning
Months 8-10: Sustained excellence with predictable performance
Google Ads campaigns need 3-6 months to truly mature, with peak performance often arriving 8-10 months into strategic management. Quick fixes rarely deliver sustainable results.
Both match types played specific roles: exact match for high-intent brand and specific solution searches, phrase match for capturing variations and related problems users are trying to solve.
The Bottom Line: Sustainable PPC Growth
This case study demonstrates what's possible when you combine strategic thinking with rigorous data analysis in Google Ads management.
The Transformation at a Glance:
*Peak single-month performance (August) balanced cost and volume with 39 qualified leads **3-month average (June-August) showing sustained performance at scale
Who This Approach Works For
This strategy is ideal for:
✅ B2B SaaS companies with clear ICPs and longer sales cycles ✅ Tech startups needing to prove efficient CAC before scaling ✅ SMBs that can't afford wasted ad spend ✅ Businesses currently struggling with PMax or automated campaigns ✅ Companies prioritizing lead quality over volume
Next Steps: Is Your Google Ads Account Underperforming?
If you're experiencing any of these warning signs, it might be time for a strategic overhaul:
🚩 Cost per lead increasing month over month 🚩 High conversion volume but poor lead quality 🚩 Relying heavily on Performance Max without visibility 🚩 Can't explain where your budget is actually going 🚩 Inconsistent performance with dramatic swings 🚩 Low Quality Scores (below 5) across campaigns 🚩 Conversion rates below 1% on Search campaigns
What a Professional PPC Audit Includes:
Account Structure Analysis - Campaign organization and targeting review
Keyword Quality Assessment - Quality Score analysis and opportunity identification
Conversion Tracking Validation - Ensuring accurate data for optimization
Audience & Targeting Review - ICP alignment check
Budget Allocation Analysis - Efficiency by campaign and channel
Competitive Landscape Review - Auction insights and positioning
90-Day Optimization Roadmap - Prioritized action plan for improvement
About This Case Study
This case study represents actual performance data from a B2B SaaS client. All data is accurate and verifiable through Google Ads reporting. Client details have been anonymized per confidentiality agreement.
Methodology: Strategic campaign restructure, continuous optimization, and data-driven decision making over 10-month period.
Tools Used: Google Ads, Google Analytics, HubSpot CRM integration, custom reporting dashboards.
Based on this case study, you can see initial improvements within the first month
(we achieved a 36% cost reduction in month one). However, optimal performance
typically requires 3–6 months as campaigns accumulate data and Google’s algorithm
learns from your conversions. The best results came in month 10 with a 74% cost per
lead reduction while scaling to 39 qualified leads.
Cost per lead varies significantly by industry, average contract value, and customer
lifetime value. For B2B SaaS, anything between $100–$500 can be considered good, but
it depends on your unit economics. The key is ensuring your CAC (Customer Acquisition
Cost) allows for profitable growth. In this case, we brought CPL from $280 down to
$179–$446 depending on scale, which aligned with the client’s business model.
Warning signs of poor performance include: cost per lead increasing monthly,
conversion rates below 1% on Search campaigns, Quality Scores below 5, erratic
performance with huge swings, inability to scale without costs skyrocketing, and
high conversion volume but poor lead quality. If you’re experiencing any of these,
an audit is recommended.
This depends on your resources and expertise. In-house management works if you have
a dedicated PPC specialist with 3+ years of experience and time for daily
optimization. An agency makes sense if you’re spending $5,000+ monthly, lack
in-house expertise, need strategic guidance, or your campaigns are underperforming.
This case study shows the impact of expert management—the previous team struggled
for 6 months before bringing in specialized help.
Questions About Performance Max (PMax)
PMax failed because it generated high volume but poor quality leads outside their
ICP. For B2B SaaS with longer sales cycles and specific buyer personas, PMax’s
automation often prioritizes easy conversions over qualified leads. It works better
for e-commerce with clear purchase signals. The lack of control over placements,
audiences, and messaging made it impossible to optimize for lead quality.
Use Performance Max when you have: clear, high-volume conversion data (500+
conversions), e-commerce or simple conversion paths, proven offers that work across
channels, and sufficient budget for Google’s algorithm to learn. Use traditional
Search and Display campaigns when you need: control over messaging by funnel stage,
precise audience targeting, B2B lead generation, or the ability to optimize based on
lead quality.
Yes, but with strict guardrails: implement lead quality scoring in your CRM and feed
it back to Google Ads, use asset groups strategically for different audiences, set
conservative target CPAs initially, run it alongside (not replacing) traditional
campaigns, and audit lead quality weekly for the first month. Never rely solely on
PMax for B2B lead generation.
Questions About Campaign Structure & Strategy
The ideal structure segments campaigns by user intent: Brand Search (high-intent,
lowest CPA), Generic Search (mid-funnel researchers), Display Remarketing
(nurturing previous visitors), and optionally YouTube or Discovery for awareness.
This case study used this exact structure with great success. Each campaign type
serves a specific purpose in the funnel and should be optimized differently.
Extremely important. Quality Scores of 7–10 can reduce your cost per click by
30–50% compared to scores of 1–4. In this case study, we focused on keywords with
Quality Scores of 4.5+ average, which contributed to the 88% reduction in average
CPC. Higher Quality Scores mean lower costs and better ad positions.
For B2B lead generation, focus on exact and phrase match. This case study used 28
exact match keywords for precision and 80 phrase match keywords for controlled
expansion—with zero broad match to eliminate waste. Phrase match delivered
$22,546 in spend with 4.9% CTR, while exact match brought $6,093 with 2.07% CTR.
Both played important roles.
Start with whatever allows 10–15 clicks per day per campaign (typically $100–$300
daily minimum for B2B). In this case study, we started conservatively at ~
$18/day in month one ($538 monthly), then scaled to ~ $580/day at peak performance
($17,377 monthly). The key is scaling based on performance, not arbitrary budget
increases.
Questions About Conversion Optimization
Low conversion rates (below 1% for Search) typically stem from: poor
keyword-to-landing page alignment, targeting wrong audiences, weak or unclear value
propositions, complicated conversion processes, mobile-unfriendly pages, or slow
page load times. This case study achieved 0.13% overall (with strict quality
filters) but 2.28% on brand searches and 1.51% on desktop traffic by focusing on
these factors.
Improving lead quality requires: stricter keyword targeting (eliminating
unqualified searches), device optimization (desktop converted 30x better than
mobile in this case), demographic targeting aligned to ICP, negative keyword lists
to filter out wrong intent, landing page messaging that qualifies visitors, and
potentially adding friction (forms asking qualifying questions). This case study
eliminated PMax’s unqualified flood by implementing all of these.
Cheaper qualified leads. This case study generated fewer total conversions
(108 vs. 135) but with much higher quality, predictable costs, and scalability.
In B2B, one qualified lead worth $10,000 LTV beats ten unqualified leads costing
$50 each. Focus on optimizing for lead quality and customer acquisition cost,
not just conversion volume.
Connect Google Ads to your CRM (HubSpot, Salesforce, etc.) and import offline
conversion data showing which leads became SQLs, opportunities, and customers.
Create custom conversions for each stage. This allows Google’s algorithm to
optimize for quality, not just form submissions. Track metrics like
lead-to-SQL rate, SQL-to-customer rate, and customer LTV by campaign.
Questions About Specific Optimizations
It depends on your audience and offer, but for B2B SaaS, desktop often performs
dramatically better. In this case study, desktop had a 1.51% conversion rate while
mobile had only 0.05%—a 30x difference. Start with both, then allocate budget based
on actual conversion data. Don’t assume mobile works just because “everyone is on
mobile.”
Analyze your conversion data by hour. This case study found 10 AM (8 conversions,
0.68% rate), 1 PM (5 conversions), and 6 PM (4 conversions) performed best.
Implement bid adjustments increasing bids 20–50% during high-performing hours and
decreasing 30–50% during low-performing times. Business hours typically win for
B2B.
Start broad, then optimize based on data. This case study found New York
($300 CPL), Michigan ($622 CPL), and Florida ($596 CPL) performed best.
Allocate more budget to these regions and reduce spend in underperforming areas.
For B2B, target metro areas with higher business density and startup ecosystems.
Daily monitoring for issues, weekly tactical optimizations (bids, budgets, negative
keywords), and monthly strategic reviews (campaign structure, audience targeting,
creative testing). This case study used this exact cadence. Avoid
over-optimization—campaigns need time to accumulate statistically significant data
before making major changes.
Questions About Costs & ROI
For B2B SaaS, a minimum of $3,000–5,000 monthly allows meaningful testing and
optimization. This case study scaled from $538 in month one to $17,377 at peak,
based on performance. The right budget depends on your goals, customer LTV, and
available market size. Start conservative, prove ROI, then scale.
For B2B SaaS, target at least 3:1 return on ad spend (ROAS), meaning every $1 spent
generates $3+ in customer lifetime value. This requires tracking beyond just lead
generation to actual revenue. If your average customer is worth $10,000 LTV and
you’re paying $500 per lead with 20% close rate, that’s a 10:1 ROAS—excellent
performance.
Cost per lead varies by channel. Google Ads typically costs more per lead than SEO
or content marketing but delivers faster results and higher intent traffic.
Compared to cold outbound or paid social, Google Ads often has better conversion
rates because users are actively searching for solutions. The key is ensuring your
unit economics support your CAC across all channels.
Common causes include: increased competition in your industry, declining Quality
Scores, ad fatigue (same creative running too long), audience saturation,
seasonality factors, or poor optimization. This case study actually decreased
costs by 88% for average CPC through strategic optimization. Regular audits
prevent cost creep.
Questions About Working With Agencies
Key factors include: proven case studies with measurable results (like this one),
transparent reporting and communication, expertise in your industry or business
model (B2B SaaS, e-commerce, etc.), strategic thinking beyond tactical execution,
reasonable pricing structure, and willingness to explain their approach. Avoid
agencies promising unrealistic results or using black-box methods.
Most agencies require 3–6 month minimums, which is reasonable given the time needed
for meaningful optimization. This case study shows why: month one showed promise,
but peak performance came in month ten. Be wary of month-to-month
arrangements—they incentivize short-term thinking over strategic growth.
At minimum: monthly performance reports (impressions, clicks, conversions, costs
by campaign), conversion funnel analysis (ad click to lead to customer),
Quality Score reports, competitive analysis (auction insights), optimization
actions taken, strategic recommendations for next period, and budget
pacing/forecasts. Ask for dashboard access so you can monitor performance anytime.
Plan for: 1–2 hour monthly strategy calls, quick Slack/email responses for
questions, quarterly business reviews, and providing feedback on
creative/messaging. You should stay informed but not micromanage. The agency
should handle day-to-day optimization while you focus on strategic direction and
providing insights about your product and customers.